Neighbourhood Search

RSS

VANCOUVER, BC – August 2, 2017 – Home buyer activity returned to more typical summer levels in Metro Vancouver* last month.

The Real Estate Board of Greater Vancouver (REBGV) reports that residential property sales in the region totalled 2,960 in July 2017, an 8.2 percent decrease from the 3,226 sales recorded in July 2016, and a decrease of 24 percent compared to June 2017 when 3,893 homes sold.

Last month’s sales were 0.7 percent above the 10-year July sales average.

“Housing demand is inconsistent across the region right now. Pockets of the market are still receiving multiple offers and others are not. It depends on price, property type, and location,” Jill Oudil, REBGV president said. “For example, it’s taking twice as long, on average, for a detached home to sell compared to both townhomes and condominiums.”

There were 5,256 detached, attached and apartment properties newly listed for sale on the Multiple Listing Service® (MLS®) in Metro Vancouver in July 2017. This represents a 0.3 percent increase compared to the 5,241 homes listed in July 2016 and an 8.1 percent decrease compared to June 2017 when 5,721 homes were listed.

The total number of properties currently listed for sale on the MLS® system in Metro Vancouver is 9,194, a 10.1 percent increase compared to July 2016 (8,351) and an eight percent increase compared to June 2017 (8,515).

“Because home sale activity decreased to more historically normal levels in July, the selection of homes for sale in the region was able to edge above 9,000 for the first time this year,” Oudil, said.

For all property types, the sales-to-active listings ratio for July 2017 is 32.2 percent. By property type, the ratio is 16.9 percent for detached homes, 44.9 percent for townhomes, and 62 percent for condominiums.

Generally, analysts say that downward pressure on home prices occurs when the ratio dips below the 12 percent mark for a sustained period, while home prices often experience upward pressure when it surpasses 20 percent over several months.

The MLS® Home Price Index composite benchmark price for all residential properties in Metro Vancouver is currently $1,019,400. This represents an 8.7 percent increase over July 2016 and a 2.1 percent increase compared to June 2017.

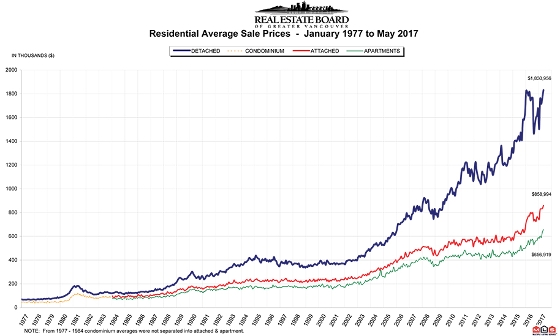
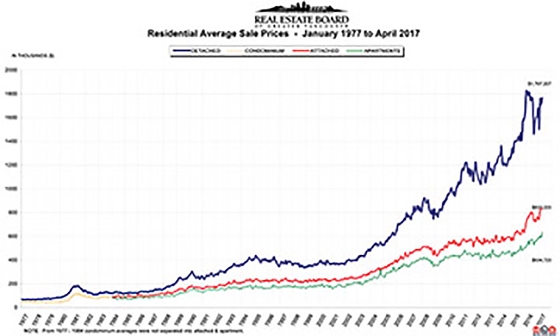
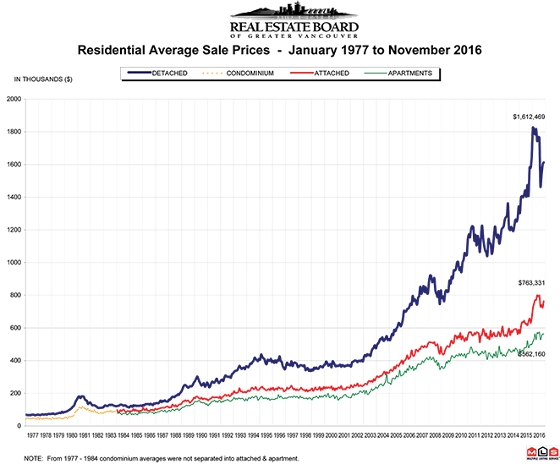
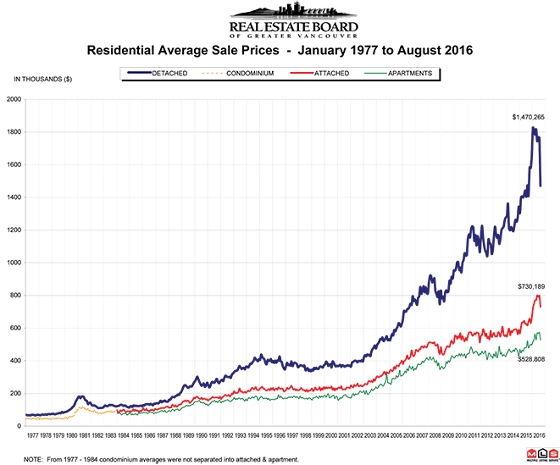
Sales of detached properties in July 2017 reached 949, a decrease of 11.9 percent from the 1,077 detached sales recorded in July 2016. The benchmark price for detached properties is $1,612,400. This represents a 1.9 percent increase from July 2016 and a 1.5 percent increase compared to June 2017.

Sales of apartment properties reached 1,468 in July 2017, a decrease of 8.4 percent compared to the 1,602 sales in July 2016. The benchmark price of an apartment property is $616,600. This represents an 18.5 percent increase from July 2016 and a 2.7 percent increase compared to June2017.

Attached property sales in July 2017 totalled 543, a decrease of 0.7 percent compared to the 547 sales in July 2016. The benchmark price of an attached unit is $763,700. This represents an 11.9 percent increase from July 2016 and a 2.4 percent increase compared to June 2017.


Download The Full Market Report Here

Read

VANCOUVER, BC – July 5, 2017 – The imbalance between supply and demand in the condominium market is creating home buyer competition across Metro Vancouver*.

The Real Estate Board of Greater Vancouver (REBGV) reports that residential property sales in the region totalled 3,893 in June 2017, an 11.5 percent decrease from the 4,400 sales recorded in June 2016, an all-time record, and a decrease of 10.8 percent compared to May 2017 when 4,364 homes sold.

Last month’s sales were 14.5 percent above the 10-year June sales average.

“Two distinct markets have emerged this summer. The detached home market has seen demand ease back to more typical levels while competition for condominiums is creating multiple offer scenarios and putting upward pressure on prices for that property type,” Jill Oudil, REBGV president said.

There were 5,721 detached, attached and apartment properties newly listed for sale on the Multiple Listing Service® (MLS®) in Metro Vancouver in June 2017. This represents a 2.6 percent decrease compared to the 5,875 homes listed in June 2016 and a 5.3 per cent decrease compared to May 2017 when 6,044 homes were listed.

The total number of properties currently listed for sale on the MLS® system in Metro Vancouver is 8,515, a nine percent increase compared to June 2016 (7,812) and a 4.2 percent increase compared to May 2017 (8,168).

“Home buyers have more selection to choose from in the detached market today while condominium listings are near an all-time low on the MLS®,” Oudil said. “Detached home listings have increased every month this year, while the number of condominiums for sale has decreased each month since February.”

For all property types, the sales-to-active listings ratio for June 2017 is 45.7 percent. By property type, the ratio is 24.5 percent for detached homes, 62 percent for townhomes, and 93.2 percent for condominiums.

Generally, analysts say that downward pressure on home prices occurs when the ratio dips below the 12 percent mark for a sustained period, while home prices often experience upward pressure when it surpasses 20 percent over several months.

“Market conditions will vary today depending on area and property type,” Oudil said. “It’s important to work with your local REALTOR® to help you understand the trends that are occurring in your community.”

The MLS® Home Price Index composite benchmark price for all residential properties in Metro Vancouver is currently $998,700. This represents a 7.9 percent increase over June 2016 and a 1.8 percent increase compared to May 2017.

Sales of detached properties in June 2017 reached 1,320, a decrease of 15.5 percent from the 1,562 detached sales recorded in June 2016. The benchmark price for detached properties is $1,587,900. This represents a 1.4 percent increase from June 2016 and a 1.1 percent increase compared to May 2017.

Sales of apartment properties reached 1,905 in June 2017, a decrease of 9.6 percent compared to the 2,108 sales in June 2016. The benchmark price of an apartment property is $600,700. This represents a 17.6 percent increase from June 2016 and a 2.9 percent increase compared to May 2017.

Attached property sales in June 2017 totalled 668, a decrease of 8.5 percent compared to the 730 sales in June 2016. The benchmark price of an attached unit is $745,700. This represents a 10.7 percent increase from June 2016 and a 0.6 percent increase compared to May 2017.


Download The Full Market Report Here

Read

VANCOUVER, BC – June 2, 2017 – Home buyer activity returned to near record levels across the Metro Vancouver* housing market in May.

Residential property sales in the region totalled 4,364 in May 2017, a decrease of 8.5 percent from the 4,769 sales in May 2016, an all-time record, and an increase of 22.8 percent compared to April 2017 when 3,553 homes sold.

Last month’s sales were 23.7 percent above the 10-year May sales average and is the thirdhighest selling May on record.

"Demand for condominiums and townhomes is driving today’s activity," Jill Oudil, Real Estate Board of Greater Vancouver (REBGV) president said. “First-time buyers and people looking to downsize from their single-family homes are both competing for these two types of housing.”

New listings for detached, attached and apartment properties in Metro Vancouver totalled 6,044 in May 2017. This represents a 3.9 percent decrease compared to the 6,289 units listed in May 2016 and a 23.2 percent increase compared to April 2017 when 4,907 homes were listed.

The month-over-month increase in new listings was led by detached homes at 27.1 percent, followed by apartments at 22.7 percent and townhomes at 14.1 percent.

The total number of properties currently listed for sale on the MLS® system in Metro Vancouver is 8,168, a 5.7 per cent increase compared to May 2016 (7,726) and a 4.5 percent increase compared to April 2017 (7,813).

"Home buyers are beginning to have more selection to choose from in the detached market, but the number of condominiums for sale continues to decline," Oudil said.

The sales-to-active listings ratio across all residential categories is 53.4 percent. By property type, the ratio is 31 per cent for detached homes, 76.1 per cent for townhomes, and 94.6 percent for condominiums.

Generally, analysts say that downward pressure on home prices occurs when the ratio dips below the 12 percent mark for a sustained period, while home prices often experience upward pressure when it surpasses 20 percent over several months.

“While sales are inching closer to the record-breaking pace of 2016, the market itself looks different. Sales last year were driven by demand for single-family homes. This year, it's clear that townhomes and condominiums are leading the way,” said Oudil. “It’s important to work with your local REALTOR® to understand the different factors affecting the market today.”

The MLS® Home Price Index composite benchmark price for all residential properties in Metro Vancouver is currently $967,500. This represents an 8.8 percent increase over May 2016 and a 2.8 percent increase compared to April 2017.

Sales of detached properties in May 2017 reached 1,548, a decrease of 17 percent from the 1,865 detached sales recorded in May 2016. The benchmark price for a detached property is $1,561,000. This represents a 3.1 percent increase over May 2016 and a 2.9 percent increase compared to April 2017.

Sales of apartment properties reached 2,025 in May 2017, a decrease of 5.8 percent compared to the 2,150 sales in May 2016.The benchmark price for an apartment property is $571,300. This represents a 17.8 percent increase over May 2016 and a 3.1 percent increase compared to April 2017.

Attached property sales in May 2017 totalled 791, an increase of 4.9 percent compared to the 754 sales in May 2016. The benchmark price for an attached property is $715,400. This represents a 13.1 percent increase over May 2016 and a 1.9 percent increase compared to April 2017.


Download The Full Market Report Here

Read

VANCOUVER, BC – May 2, 2017 – Demand for condominiums and townhomes continues to drive the Metro Vancouver* housing market.

Residential property sales in the region totalled 3,553 in April 2017, a 25.7 percent decline compared to April 2016 when 4,781 homes sold and a 0.7 percent decrease from the 3,579 sales recorded in March 2017.

April sales were 4.8 percent above the 10-year average for the month.

For the first four months of the year, condominium and townhome sales have comprised a larger percentage of all residential sales on the Multiple Listing Service® (MLS®) in Metro Vancouver. Over this time, they’ve accounted for 68.5 percent, on average, of all residential sales. This is up 10 percent from the 58.2 percent average over the same period last year.

“Our overall market is operating below the record-setting pace from a year ago and is in line with historical spring levels. It’s a different story in our condominium and townhome markets," Jill Oudil, Real Estate Board of Greater Vancouver (REBGV) president said. “Demand has been increasing for months and supply is not keeping pace. This dynamic is causing prices to increase and making multiple offer scenarios the norm.”

New listings for detached, attached and apartment properties in Metro Vancouver totalled 4,907 in April 2017. This represents a decrease of 19.9 percent compared to the 6,127 units listed in April 2016 and a three pe cent increase compared to March 2017 when 4,762 properties were listed.

The total number of residential properties currently listed for sale on the MLS® system in Metro Vancouver is 7,813, a 3.5 percent increase compared to April 2016 (7,550) and a three percent increase compared to March 2017 (7,586).

The sales-to-active listings ratio for April 2017 is 45.5 percent for all property types. This is two percent below March 2017 and is indicative of a sellers’ market. Generally, analysts say that downward pressure on home prices occurs when the ratio dips below the 12 percent mark for a sustained period, while home prices often experience upward pressure when it surpasses 20 percent over several months.

By property type, the sales-to-active listings ratio is 26 per cent for detached homes, 58.2 percent for townhomes, and 82.2 percent for condominiums.

“Until more entry level, or ‘missing middle’, homes are available for sale in our market, we’ll likely continue to see prices increase,” Oudil said. “There’s been record building this past year, but much of that inventory isn’t ready to hit the market.”

The MLS® Home Price Index composite benchmark price for all residential properties in Metro Vancouver is currently $941,100. This represents a five percent increase over the past three months and an 11.4 percent increase compared to April 2016.

Over the last three months, the benchmark price of condominiums has seen the largest increase in the region at 8.2 percent, followed by townhomes at 5.3 per cent, and detached homes at 2.8 percent.

“Home buyers are looking to get into the market and they’re facing fierce competition,” Oudil said. “It’s important to work with your local Realtor to help you navigate today’s marketplace.”

Sales of detached properties in April 2017 reached 1,211, a decrease of 38.8 percent from the 1,979 detached sales recorded in April 2016. The benchmark price for detached properties is $1,516,500. This represents an 8.1 percent increase over the last 12 months and a 1.8 percent increase compared to March 2017.

Sales of apartment, or condominium, properties reached 1,722 in April 2017, a decrease of 18.3 percent compared to the 2,107 sales in April 2016.The benchmark price of an apartment property is $554,100. This represents a 16.6 percent increase over the past 12 months and a 3.1 percent increase compared to March 2017.

Attached, or townhome, property sales in April 2017 totalled 620, a decrease of 10.8 percent compared to the 695 sales in April 2016. The benchmark price of an attached unit is $701,800. This represents a 15.3 percent increase over the past 12 months and a 2.4 percent increase compared to March 2017.


Download The Full Market Report Here

Read

VANCOUVER, BC – April 4, 2017 – A shortage of residential property listings coupled with strong demand, particularly for condos and townhomes, continued to impact Metro Vancouver’s housing market in March.

Residential property sales in the region totalled 3,579 in March 2017, a decrease of 30.8 percent from the 5,173 sales recorded in record-breaking March 2016 and an increase of 47.6 percent compared to February 2017 when 2,425 homes sold.

Last month’s sales were 7.9 percent above the 10-year sales average for the month.

“While demand in March was below the record high of last year, we saw demand increase month-to-month for condos and townhomes,” Jill Oudil, Real Estate Board of Greater Vancouver (REBGV) president said. “Sellers still seem reluctant to put their homes on the market, making for stiff competition among home buyers.”

New listings for detached, attached and apartment properties in Metro Vancouver totalled 4,762 in March 2017. This represents a decrease of 24.1 percent compared to the 6,278 units listed in March 2016 and a 29.9 percent increase compared to February 2017 when 3,666 properties were listed.

This is the lowest number of new listings in March since 2009.

The total number of properties currently listed for sale on the MLS® system in Metro Vancouver is 7,586, a 3.1 percent increase compared to March 2016 (7,358) and a 0.1 percent decrease compared to February 2017 (7,594).

The sales-to-active listings ratio for March 2017 is 47.2 percent, a 15-point increase over February. Generally, analysts say that downward pressure on home prices occurs when the ratio dips below the 12 percent mark for a sustained period, while home prices often experience upward pressure when it surpasses 20 percent over several months.

“Home prices will likely continue to increase until we see more housing supply coming on to the market,” Oudil said.

The MLS® Home Price Index composite benchmark price for all residential properties in Metro Vancouver is currently $919,300. This represents a 0.8 percent decrease over the past six months and a 1.4 percent increase compared to February 2017.

Sales of detached properties in March 2017 reached 1,150, a decrease of 46.1 percent from the 2,135 detached sales recorded in March 2016. The benchmark price for detached properties is $1,489,400. This represents a 5.0 percent decrease over the past six months and a one percent increase compared to February 2017.

Sales of apartment properties reached 1,841 in March 2017, a decrease of 18.3 percent compared to the 2,252 sales in March 2016.The benchmark price of an apartment property is $537,400. This represents a 5.2 percent increase over the past six months and a 2.1 percent increase compared to February 2017.

Attached property sales in March 2017 totalled 588, a decrease of 25.2 percent compared to the 786 sales in March 2016. The benchmark price of an attached unit is $685,100. This represents a 1.3 percent increase over the past six months and a 1.4 percent increase compared to February 2017.


Download The Full Market Report Here

Read

VANCOUVER, BC – February 2, 2017 – Home sales and listings trends are below long-term averages in the Metro Vancouver* housing market. This is due largely to reduced activity in the detached home market.

Residential property sales in the region totalled 1,523 in January 2017, a 39.5 percent decrease from the 2,519 sales recorded in January 2016 and an 11.1 percent decrease compared to December 2016 when 1,714 homes sold.

Last month’s sales were 10.3 per cent below our 10-year January sales average.

“From a real estate perspective, it’s a lukewarm start to the year compared to 2016,” Dan Morrison, Real Estate Board of Greater Vancouver (REBGV) president said. “While we saw near record-breaking sales at this time last year, home buyers and sellers are more reluctant to engage so far in 2017.”

New listings for detached, attached and apartment properties in Metro Vancouver totalled 4,140 in January 2017. This represents a 6.8 percent decrease compared to the 4,442 homes listed in January 2016 and a 215.5 percent increase compared to December 2016 when 1,312 properties were listed.

The total number of homes currently listed for sale on the Multiple Listing Service® (MLS®) in Metro Vancouver is 7,238, a 9.1 percent increase compared to January 2016 (6,635) and a 14.1 percent increase compared to December 2016 (6,345).

The sales-to-active listings ratio for January 2017 is 21 percent. This is the lowest the ratio has been in the region since January 2015. Generally, analysts say that downward pressure on home prices occurs when the ratio dips below the 12 percent mark for a sustained period, while home prices often experience upward pressure when it surpasses 20 percent over several months.

“Conditions within the market vary depending on property type. The townhome and condominium markets are more active than the detached market at the moment,” Morrison said. “As a result, detached home prices declined about 7 percent since peaking in July while townhome and condominium prices held steady over this period.”

The MLS® Home Price Index composite benchmark price for all residential properties in Metro Vancouver is currently $896,000. This represents a 3.7 percent decline over the past six months and a 0.2 percent decrease compared to December 2016.

Sales of detached properties in January 2017 reached 444, a decrease of 57.6 percent from the 1,047 detached sales recorded in January 2016. The benchmark price for detached properties is $1,474,800. This represents a 6.6 percent decline over the last six months and a 0.6 percent decrease compared to December 2016.

Sales of apartment properties reached 825 in January 2017, a decrease of 24.7 percent compared to the 1,096 sales in January 2016.The benchmark price of an apartment property is $512,300. This represents a 0.3 percent increase over the last six months and a 0.4 percent increase compared to December 2016.

Attached property sales in January 2017 totalled 254, a decrease of 32.4 percent compared to the 376 sales in January 2016. The benchmark price of an attached unit is $666,500. This represents a 0.4 percent decline over the last six months and a 0.7 percent increase compared to December 2016.


Download The Full Market Report Here

Read

VANCOUVER, BC – January 4, 2017 – The Metro Vancouver* housing market had its third highest selling year on record in 2016, behind only 2015 and 2005.

Sales of detached, attached and apartment properties in the region reached 39,943 in 2016, a 5.6 percent decrease from the 42,326 sales recorded in 2015, and a 20.6 percent increase over the 33,116 residential sales in 2014.

“It was an eventful year for real estate in Metro Vancouver. Escalating prices caused by low supply and strong home buyer demand brought more attention to the market than ever before,” Dan Morrison, Real Estate Board of Greater Vancouver (REBGV) president said.

“As prices rose in the first half of the year, public debate waged about what was fuelling demand and what should be done to stop it. This led to multiple government interventions into the market. The long-term effects of these actions won’t be fully understood for some time.”

Residential properties listed for sale on the Multiple Listing Service® (MLS®) in Metro Vancouver reached 57,596 in 2016. This is an increase of 0.6 percent compared to the 57,249 properties listed in 2015 and a 2.6 percent increase compared to the 56,066 properties listed in 2014.

“The supply of homes for sale couldn't keep up with home buyer demand for much of 2016. This allowed home sellers to raise their asking price. It wasn’t until the last half of the year that prices began to show modest declines.”

The MLS® Home Price Index (HPI) composite benchmark price for all residential properties in Metro Vancouver ends the year at $897,600. This represents a 2.2 percent decrease over the past six months and a 17.8 percent increase compared to December 2015.

December summary

Residential property sales in the region totalled 1,714 in December 2016, a decrease of 39.4 percent from the 2,827 sales recorded in December 2015 and a decrease of 22.6 percent compared to November 2016 when 2,214 homes sold.

Last month’s sales were 8.1 percent below the 10-year sales average for the month.

New listings for detached, attached and apartment properties in Metro Vancouver totalled 1,312 in December 2016. This represents a decrease of 35.1 percent compared to the 2,021 units listed in December 2015 and a 58.3 percent decrease compared to November 2016 when 3,147 properties were listed.

The total number of properties currently listed for sale on the MLS® in Metro Vancouver is 6,345, a 5.3 percent increase compared to December 2015 (6,024) and a 24.3 percent decrease compared to November 2016 (8,385).

Sales of detached properties in December 2016 reached 541, a decrease of 52.4 percent from the 1,136 detached sales recorded in December 2015. The benchmark price for detached properties is $1,483,500. This represents an 18.6 percent increase compared to December 2015 and a 1.8 percent decrease compared to November 2016.

Sales of apartment properties reached 915 in December 2016, a decrease of 25.3 percent compared to the 1,225 sales in December 2015.The benchmark price of an apartment property is $510,300. This represents a 17.3 percent increase compared to December 2015 and a 0.3 percent decrease compared to November 2016.


Download The Full Market Report Here

Read

VANCOUVER, BC – December 2, 2016 – Home buyer and seller activity remains near historical averages in the Metro Vancouver* housing market.

Residential home sales in the region totalled 2,214 in November 2016, a decrease of 0.9 percent from the 2,233 sales recorded in October 2016 and a decrease of 37.2 percent compared to November 2015 when 3,524 homes sold.

Last month’s sales were 7.6 percent below the 10-year sales average for the month.

“While 2016 has been anything but a normal year for the Metro Vancouver housing market, supply and demand totals have returned to more historically normal levels over the last few months,” said Dan Morrison, Real Estate Board of Greater Vancouver (REBGV) president.

New listings for detached, attached and apartment properties in Metro Vancouver totalled 3,147 in November 2016. This represents a decrease of 20.9 percent compared to the 3,981 units listed in October 2016 and a 7.2 percent decrease compared to November 2015 when 3,392 properties were listed.

Last month’s new listing count was 1.2 percent below the region’s 10-year new listing average for the month.

The total number of properties currently listed for sale on the MLS® system in Metro Vancouver is 8,385, an 8.3 percent decrease compared to October 2016 (9,143) and a 3.6 percent increase compared to November 2015 (8,096).

The sales-to-active listings ratio for November 2016 is 26.4 percent. This is up two percent from last month (24.4 percent).

Downward pressure on home prices can occur when the ratio dips below the 12 percent mark for a sustained period, while home prices can experience upward pressure when it surpasses 20 percent over several months.

“Demand, relative to supply, for detached homes is lower right now than demand for townhomes and apartments,” Morrison said. “This is causing prices to remain stable, or flat, for townhomes and apartments, while detached homes are seeing modest month-over-moth declines.”

The MLS® Home Price Index composite benchmark price for all residential properties in Metro Vancouver is currently $908,300. This represents a 1.2 percent decrease compared to last month and a 20.5 percent increase compared to November 2015.

Sales of detached properties in November 2016 reached 638, a decrease of 2.1 percent from the 652 detached sales recorded in October 2016 and a 52.2 percent decline over November 2015.The benchmark price for detached properties is $1,511,100. This represents a 2.2 percent decline compared to last month and a 23 percent increase compared to November 2015.

Sales of apartment properties reached 1,200 in November 2016, an increase of 1.9 percent compared to the 1,178 sales in October 2016 and a 22.7 percent decrease compared to November 2015.The benchmark price of an apartment property is $512,100. This is unchanged from last month and is an 18 percent increase compared to November 2015.

Attached property sales in November 2016 totalled 376, a decrease of 6.7 percent compared to the 403 sales in October 2016 and a 40.9 percent decline compared to November 2015. The benchmark price of an attached unit is $667,100. This represents a 0.3 percent decrease compared to last month and a 23 per cent increase compared to November 2015.


Download The Full Market Report Here

Read

VANCOUVER, BC – November 2, 2016 – Reduced home sale and listing activity are changing market dynamics in communities across Metro Vancouver*.

Residential property sales in the region totalled 2,233 in October 2016, a 38.8 percent decrease from the 3,646 sales recorded in October 2015 and a 0.9 percent decrease compared to September 2016 when 2,253 homes sold.

Last month’s sales were 15 percent below the 10-year October sales average.

“Changing market conditions compounded by a series of government interventions this year have put home buyers and sellers in a holding pattern,” Dan Morrison, Real Estate Board of Greater Vancouver (REBGV) president said. “Potential buyers and sellers are taking a wait-andsee approach to try and better understand what these changes mean for them.”

New listings for detached, attached and apartment properties in Metro Vancouver totalled 3,981 in October 2016. This represents a decrease of 3.5 percent compared to the 4,126 units listed in October 2015 and a 17 percent decrease compared to September 2016 when 4,799 properties were listed.

Last month’s new listing count was 9.5 percent below the region’s 10-year new listing average for the month.

The total number of properties currently listed for sale on the MLS® system in Metro Vancouver is 9,143, a 4.5 percent decrease compared to October 2015 (9,569) and a 2.3 percent decrease compared to September 2016 (9,354).

The sales-to-active listings ratio for October 2016 is 24.4 percent. Generally, analysts say that downward pressure on home prices occurs when the ratio dips below the 12 per cent mark for a sustained period, while home prices often experience upward pressure when it surpasses 20 percent over several months.

“While sales are down across the different property types, it’s the detached market that’s seen the largest reduction in home buyer demand in recent months,” Morrison said. “It’s important to work with your local REALTOR® to help you navigate today’s changing trends.”

The MLS® Home Price Index composite benchmark price for all residential properties in Metro Vancouver is currently $919,300. This represents a 24.8 percent increase compared to October 2015 and a 0.8 percent decline compared to September 2016.

Sales of detached properties in October 2016 reached 652, a decrease of 54.6 percent from the 1,437 detached sales recorded in October 2015. The benchmark price for detached properties is $1,545,800. This represents a 28.9 percent increase compared to October 2015 and a 1.4 percent decrease compared to September 2016.

Sales of apartment properties reached 1,178 in October 2016, a decrease of 23.7 percent compared to the 1,543 sales in October 2015.The benchmark price of an apartment property is $512,300. This represents a 20.5 percent increase compared to October 2015 and a 0.3 per cent increase compared to September 2016.

Attached property sales in October 2016 totalled 403, a decrease of 39.5 percent compared to the 666 sales in October 2015. The benchmark price of an attached unit is $669,200. This represents a 25.7 percent increase compared to October 2015 and a 1.1 per cent decrease compared to September 2016.


Download The Full Market Report Here

Read

VANCOUVER, BC – October 4, 2016 – Metro Vancouver* home sales dipped below the 10- year monthly sales average last month.

Metro Vancouver home sales totalled 2,253 in September 2016, a decrease of 32.6 percent from the 3,345 sales recorded in September 2015 and a decrease of 9.5 percent compared to August 2016 when 2,489 homes sold.

Last month’s sales were 9.6 percent below the 10-year sales average for the month.

“Supply and demand conditions differ today depending on property type,” Dan Morrison, REBGV president said. “We’re seeing more demand for condominiums and townhomes today than in the detached home market.”

New listings for detached, attached and apartment properties in Metro Vancouver totalled 4,799 in September 2016. This represents a decrease of one percent compared to the 4,846 units listed in September 2015 and an 11.8 percent increase compared to August 2016 when 4,293 properties were listed.

The total number of homes currently listed for sale on the MLS® system in Metro Vancouver is 9,354, a 13.4 percent decline compared to September 2015 (10,805) and a 10 percent increase compared to August 2016 (8,506).

The sales-to-active listings ratio for September 2016 is 24.1 percent. This is the lowest this ratio has been since February 2015. Generally, analysts say that downward pressure on home prices occurs when the ratio dips below the 12 percent mark, while home prices often experience upward pressure when it reaches the 20 to 22 percent range in a particular community for a sustained period.

“Changing market conditions are easing upward pressure on home prices in our region,” Morrison said. “There’s uncertainty in the market at the moment and home buyers and sellers are having difficulty establishing price as a result. To help you understand the factors affecting prices, it’s important to talk with a REALTOR®.”

The MLS® Home Price Index composite benchmark price for all residential properties in Metro Vancouver is currently $931,900. This represents a 28.9 percent increase compared to September 2015 and a 0.1 percent decline compared to August 2016.

Sales of detached properties in September 2016 reached 666, a decrease of 47.6 percent from the 1,272 detached sales recorded in September 2015. The benchmark price for detached properties is $1,579,400. This represents a 33.7 percent increase compared to September 2015 and a 0.1 percent increase compared to August 2016.

Sales of apartment properties reached 1,218 in September 2016, a decrease of 20.3 percent compared to the 1,529 sales in September 2015.The benchmark price of an apartment property is $511,800. This represents a 23.5 percent increase compared to September 2015 and a 0.5 percent decline compared to August 2016.

Attached property sales in September 2016 totalled 369, a decrease of 32.2 percent compared to the 544 sales in September 2015. The benchmark price of an attached unit is $677,000. This represents a 29.1 percent increase compared to September 2015 and a 0.1 percent decline compared to August 2016.


Download The Full Market Report Here

Read

VANCOUVER, BC – September 2, 2016 – For the second straight month, home buyer demand in

Metro Vancouver* moved off of the record-breaking pace seen earlier this year and returned to more typical levels.

The Real Estate Board of Greater Vancouver (REBGV) reports that residential property sales in Metro Vancouver totalled 2,489 in August 2016, a decline of 26 per cent compared to the 3,362 sales in August 2015; 10.2 percent less than the 2,771 sales in August 2014; and one percent less than the 2,514 sales in August 2013. August 2016 sales also represent a 22.8 percent decline compared to lastmonth’s sales.

From a historical perspective, last month’s sales were 3.5 percent below the 10-year sales average for the month.

“The record-breaking sales we saw earlier this year were replaced by more historically normal activity throughout July and August,” Dan Morrison, REBGV president said. "Sales have been trending downward in Metro Vancouver for a few months. The new foreign buyer tax appears to have added to this trend by reducing foreign buyer activity and causing some uncertainty amongst local home buyers and sellers.

“It’ll take some months before we can really understand the impact of the new tax. We'll be interested to see the government's next round of foreign buyer data."

New listings for detached, attached and apartment properties in Metro Vancouver totalled 4,293 in August 2016. This represents an increase of 0.3 percent compared to the 4,281 units listed in August 2015 and an 18.1 percent decrease compared to July 2016 when 5,241 properties were listed.

The total number of properties currently listed for sale on the MLS® in Metro Vancouver is 8,506, a 21.9 percent decline compared to August 2015 (10,897) and a 1.9 percent increase from July 2016 (8,351).

The sales-to-active listings ratio for August 2016 is 29.3 percent. This is indicative of a seller’s market.

Generally, analysts say that downward pressure on home prices occurs when the ratio dips below the 12 percent mark, while home prices often experience upward pressure when it reaches the 20 to 22 percent range in a particular community for a sustained period.

The MLS® Home Price Index composite benchmark price for all residential properties in Metro Vancouver is currently $933,100. This represents a 31.4 percent increase compared to August 2015 and a 4.9 percent increase over the last three months.

“In aggregate, we continue to see an imbalance between supply and demand in most communities. However, we’re also seeing fewer detached sales in the highest price points and fewer detached home sales relative to all residential sales,” Morrison said. “This is causing average sale prices to show a decline in recent months, while benchmark home prices remain virtually unchanged from July.”

The average price is the simplest home price measure to explain but is not the most accurate since it may be skewed by the mix of properties. More high-end or low-end sales will skew the number up or down. Based on the Consumer Price Index, MLS HPI® benchmark prices are a more reliable and stable indicator of typical home prices across regions over time.

Sales of detached properties in August 2016 reached 715, a decrease of 44.6 percent from the 1,290 detached sales recorded in August 2015. The benchmark price for detached properties increased 35.8 percent from August 2015 to $1,577,300. This represents a 4.2 percent increase over the last three months.

Sales of apartment properties reached 1,343 in August 2016, a decrease of 10.1 percent compared to the 1,494 sales in August 2015.The benchmark price of an apartment property increased 26.9 percent from August 2015 to $514,300. This represents a 6.1 per cent increase over the last three months.

Attached property sales in August 2016 totalled 431, a decrease of 25.4 percent compared to the 578 sales in August 2015. The benchmark price of an attached home increased 31.1 percent from August 2015 to $677,600. This represents a 7.1 percent increase over the last three months.


Download The Full Market Report Here

Read

VANCOUVER, BC – June 2, 2016 – Metro Vancouver* homes continue to sell at an unprecedented rate in communities across the region.

Residential property sales on the region's Multiple Listing Service® (MLS®) totalled 4,769 in May 2016, an increase of 17.6 percent from the 4,056 sales recorded in May 2015 and a decrease of 0.3 percent compared to April 2016 when 4,781 homes sold.

Last month’s sales were 35.3 percent above the 10-year sales average for the month and rank as the highest sales total on record for May.

"Home sellers are becoming more active in recent months, although that activity is being outpaced by home buyer demand today," Dan Morrison, REBGV president said.

New listings for detached, attached and apartment properties in Metro Vancouver totalled 6,289 in May 2016. This represents an increase of 11.5 percent compared to the 5,641 units listed in May 2015 and a 2.6 percent increase compared to April 2016 when 6,127 properties were listed.

The total number of properties currently listed for sale on the MLS® system in Metro Vancouver is 7,726, a 37.3 percent decline compared to May 2015 (12,336) and a 2.3 percent increase compared to April 2016 (7,550).

"Economic and job growth in Metro Vancouver is out performing most regions in the country. This is helping to underpin today’s activity," Morrison said.

The sales-to-active listings ratio for May 2016 is 61.7 percent. This is indicative of a seller’s market.

Generally, analysts say that downward pressure on home prices occurs when the ratio dips below the 12 percent mark, while home prices often experience upward pressure when it reaches the 20 to 22 percent range in a particular community for a sustained period of time.

The MLS® Home Price Index composite benchmark price for all residential properties in Metro Vancouver is currently $889,100. This represents a 29.7 percent increase compared to May 2015.

Sales of detached properties in May 2016 reached 1,865, an increase of 8.2 percent from the 1,723 detached sales recorded in May 2015. The benchmark price for detached properties increased 36.9 percent from May 2015 to $1,513,800.

Sales of apartment properties reached 2,150 in May 2016, an increase of 34.4 percent compared to the 1,600 sales in May 2015. The benchmark price of an apartment property increased 22.3 percent from May 2015 to $485,000.

Attached property sales in May 2016 totalled 754, an increase of 2.9 percent compared to the 733 sales in May 2015. The benchmark price of an attached unit increased 24.9 percent from May 2015 to $632,400.


Download The Full Market Report Here

Read

VANCOUVER, B.C. – April 4, 2016 –Metro Vancouver* home sales eclipsed 5,000 in March for the first time on record.

Residential property sales in the region totalled 5,173 in March 2016, an increase of 27.4 percent from the 4,060 sales recorded in March 2015 and an increase of 24 per cent compared to February 2016 when 4,172 homes sold.

Last month’s sales were 56 percent above the 10-year sales average for the month.

"March was the highest selling month the REBGV has ever recorded,” Dan Morrison, REBGV president said. “Today's demand is broad based. Home buyers are active in neighbourhoods across our region."

New listings for detached, attached and apartment properties in Metro Vancouver totalled 6,278 in March 2016. This represents an increase of 5.2 percent compared to the 5,968 units listed in March 2015 and an 8 percent increase compared to February 2016 when 5,812 properties werelisted.

The total number of properties currently listed for sale on the MLS® system in Metro Vancouver is 7,358, a 40.5 percent decline compared to March 2015 (12,376) and a 0.8 percent increase compared to February 2016 (7,299).

“Strong job and economic growth in our province, positive net migration and low interest rates are helping to drive this activity," Morrison said.

The MLS® Home Price Index composite benchmark price for all residential properties in Metro Vancouver is currently $815,000. This represents a 23.2 percent increase compared to March 2015.

Sales of detached properties in March 2016 reached 2,135, an increase of 24.8 percent from the 1,711 detached sales recorded in March 2015. The benchmark price for detached properties increased 27.4 percent from March 2015 to $1,342,500.

Sales of apartment properties reached 2,252 in March 2016, an increase of 38.4 percent compared to the 1,627 sales in March 2015.The benchmark price of an apartment property increased 18.8 percent from March 2015 to $462,800.

Attached property sales in March 2016 totalled 786, an increase of 8.9 percent compared to the 722 sales in March 2015. The benchmark price of an attached unit increased 20.1 percent from March 2015 to $589,100.


Download The Full Market Report Here

Read

VANCOUVER, B.C. – March 2, 2016 – Last month was the highest selling February on record for the Metro Vancouver* housing market.

Residential property sales in the region totalled 4,172 in February 2016, an increase of 36.3 percent from the 3,061 sales recorded in February 2015 and an increase of 65.6 percent compared to January 2016 when 2,519 homes sold.

Last month’s sales were 56.3 percent above the 10-year sales average for the month and rank as the highest February sales total on record.

“We're in a competitive, fast-moving market cycle that favours home sellers,” Darcy McLeod, REBGV president said. “Sustained home buyer competition is keeping upward pressure on home prices across the region.”

New listings for detached, attached and apartment properties in Metro Vancouver totalled 5,812 in February 2016. This represents an increase of 7.1 percent compared to the 5,425 units listed in February 2015 and a 30.8 percent increase compared to January 2016 when 4,442 properties were listed.

“We're beginning to see home listings increase as we head toward the spring market, however, additional supply is still needed to meet today's demand,” McLeod said.

The total number of properties currently listed for sale on the MLS® system in Metro Vancouver is 7,299, a 38.7 percent decline compared to February 2015 (11,898) and a 10 percent increase compared to January 2016 (6,635).

The sales-to-active listings ratio for February 2016 is 57.2 percent. This is indicative of a seller’s market.

Generally, analysts say that downward pressure on home prices occurs when the ratio dips below the 12 percent mark, while home prices often experience upward pressure when it reaches the 20 to 22 percent range in a particular community for a sustained period of time.

The MLS® Home Price Index composite benchmark price for all residential properties in Metro Vancouver is currently $795,500. This represents a 22.2 percent increase compared to February 2015.

Sales of detached properties in February 2016 reached 1,778, an increase of 37.2 percent from the 1,296 detached sales recorded in February 2015. The benchmark price for detached properties increased 27 percent from February 2015 to $1,305,600.

Sales of apartment properties reached 1,790 in February 2016, an increase of 43.9 percent compared to the 1,244 sales in February 2015.The benchmark price of an apartment property increased 17.7 percent from February 2015 to $454,600.

Attached property sales in February 2016 totalled 604, an increase of 15.9 percent compared to the 521 sales in February 2015. The benchmark price of an attached unit increased 17 percent from February 2015 to $569,600.


Download The Full Market Report Here

Read

VANCOUVER, B.C. – January 5, 2016 – In a year when the number of homes listed for sale was below historical averages, actual home sales in Metro Vancouver set a new record.

The Real Estate Board of Greater Vancouver (REBGV) reports that 2015 home sales were the highest annual total in REBGV history. This was powered early in the year by four straight months with more than 4,000 sales a month from March to June, another first for REBGV.

Sales of detached, attached and apartment properties in 2015 reached 42,326, a 27.8 percent increase from the 33,116 sales recorded in 2014, and a 48.4 percent increase over the 28,524 residential sales in 2013.

The total number of homes listed for sale on the MLS® in 2015 ranked fifth in the last ten years, while the MLS® Home Price Index (HPI) saw double-digit year-over-year price increases.

The number of residential properties listed for sale on the Multiple Listing Service® (MLS®) in Metro Vancouver in 2015 reached 57,249. This is an increase of 2.1 percent compared to the 56,066 properties listed in 2014 and an increase of 4.6 percent compared to the 54,742 properties listed in 2013.

With sales-to-active-listings ratios above 25 percent for 11 months in 2015, the Metro Vancouver market experienced seller’s market conditions for much of the year.

"Home buyers were active and motivated throughout 2015 despite the pressure on supply of homes on the market," Darcy McLeod, REBGV president said. "Housing markets typically experience quieter periods within a calendar year, but that wasn't the case in Metro Vancouver last year."

The MLS® Home Price Index composite benchmark price for all residential properties in Metro Vancouver ends the year at $760,900. This represents an 18.9 percent increase compared to December 2014.

“We often hear economists say that seller’s market conditions put upward pressure on home prices,” McLeod said. “That was certainly the case in 2015, with price increases ranging from 14 to 24 percent depending on property type.”

December summary

Residential property sales in Greater Vancouver totalled 2,827 in December 2015, an increase of 33.6 percent from the 2,116 sales recorded in December 2014 and a 19.8 percent decline compared to November 2015 when 3,524 home sales occurred.

New listings for detached, attached and apartment properties in Greater Vancouver totalled 2,021 in December 2015. This represents a 7 percent increase compared to the 1,888 units listed in December 2014 and a 40.4 percent decline compared to November 2015 when 3,392 properties were listed.

The total number of properties currently listed for sale on the MLS® system in Metro Vancouver is 6,024, a 41.6 percent decline compared to December 2014 and a 25.6 percent decrease compared to November 2015.

Sales of detached properties in December 2015 reached 1,136, an increase of 36.4 percent from the 833 detached sales recorded in December 2014. The benchmark price for detached properties increased 24.3 percent from December 2014 to $1,248,600.

Sales of apartment properties reached 1,225 in December 2015, an increase of 34.3 percent compared to the 912 sales in December 2014.The benchmark price of an apartment property increased 14 percent from December 2014 to $436,200.

Attached property sales in December 2015 totalled 466, an increase of 25.6 percent compared to the 371 sales in December 2014. The benchmark price of an attached unit increased 13.6 percent from December 2014 to $543,700.


Download The Full Market Report Here

Read

VANCOUVER, B.C. – December 2, 2015 – Home sales reached near record levels in November even as home listings began the traditional year-end decline.

The Real Estate Board of Greater Vancouver (REBGV) reports that residential property sales in Metro Vancouver reached 3,524 on the Multiple Listing Service® (MLS®) in November 2015. This represents a 40.1 percent increase compared to the 2,516 sales recorded in November 2014, and a 3.3 percent decrease compared to the 3,646 sales in October 2015.

Last month’s sales were 46.2 percent above the 10-year sales average for the month and rank as the second highest November on record for residential property sales.

“November is typically one of the quietest months of the year in our housing market, but not this year,” Darcy McLeod, REBGV president said. “The ratio of sales to home’s available for sale reached 44 percent in November, which is the highest it’s been in our market in nine years.”

New listings for detached, attached and apartment properties in Metro Vancouver totalled 3,392 in November. This represents a 12.5 percent increase compared to the 3,016 new listings reported in November 2014.

The total number of properties listed for sale on the real estate board’s MLS® is 8,096, a 35 percent decline compared to November 2014 and a 15.4 percent decline compared to October 2015.

“Demand remains strong and there are housing options at different price points throughout the region,” McLeod said. “It’s important to work with your REALTOR® to understand your options before you embark on your home buying journey.”

The MLS® Home Price Index composite benchmark price for all residential properties in Metro Vancouver is currently $752,500. This represents a 17.8 percent increase compared to November 2014.

The sales-to-active-listings ratio in November was 43.5 percent. Generally, analysts say that downward pressure on home prices occurs when the ratio declines below the 12 percent mark, while home prices often experience upward pressure when it reaches 20 percent, or higher, in a particular community for a sustained period of time.

Sales of detached properties in November 2015 reached 1,335, an increase of 31.9 percent from the 1,012 detached sales recorded in November 2014, and a 44.2 percent increase from the 926 units sold in November 2013. The benchmark price for a detached property in Metro Vancouver increased 22.6 percent from November 2014 to $1,226,300.

Sales of apartment properties reached 1,553 in November 2015, an increase of 47.6 percent compared to the 1,052 sales in November 2014, and an increase of 60.3 percent compared to the 969 sales in November 2013. The benchmark price of an apartment property increased 14 percent from November 2014 to $435,000.

Attached property sales in November 2015 totalled 636, an increase of 40.7 percent compared to the 452 sales in November 2014, and a 49.3 percent increase from the 426 attached properties sold in November 2013. The benchmark price of an attached unit increased 11.3 percent between November 2014 and 2015 to $536,600.


Download The Full Market Report Here

Read

VANCOUVER, B.C. – November 3, 2015 – Home buyers remain active across Metro Vancouver despite a reduced supply of homes for sale.

The Real Estate Board of Greater Vancouver (REBGV) reports that residential property sales in *Metro Vancouver reached 3,646 on the Multiple Listing Service® (MLS®) in October 2015. This represents a 19.3 percent increase compared to the 3,057 sales recorded in October 2014, and a 9 percent increase compared to the 3,345 sales in September 2015.

Last month’s sales were 36.2 percent above the 10-year sales average for the month.

“Home sales are more than one-third above what’s typical for this time of year yet the supply of homes for sale is the lowest we’ve seen in five years,” Darcy McLeod, REBGV president said. “This activity has created favourable market conditions for anyone considering selling their home today.”

New listings for detached, attached and apartment properties in Metro Vancouver totalled 4,126 in October. This represents an 8 percent decline compared to the 4,487 new listings reported in October 2014.

The total number of properties listed for sale on the real estate board’s MLS® is 9,569, a 30 percent decline compared to October 2014 and an 11.4 percent decline compared to September
2015.

This is the lowest active listing total in Metro Vancouver since December 2010.

The MLS® Home Price Index composite benchmark price for all residential properties in Metro Vancouver is currently $736,000. This represents a 15.3 percent increase compared to October 2014.

The sales-to-active-listings ratio in October was 38.1 percent. Generally, analysts say that downward pressure on home prices occurs when the ratio declines below the 12 percent mark, while home prices often experience upward pressure when it reaches 20 percent, or higher, in a particular community for a sustained period of time.

Sales of detached properties in October 2015 reached 1,437, an increase of 13.1 percent from the 1,271 detached sales recorded in October 2014, and a 34.7 percent increase from the 1,067 units sold in October 2013. The benchmark price for a detached property in Metro Vancouver increased 20.1 percent from October 2014 to $1,197,600.

Sales of apartment properties reached 1,543 in October 2015, an increase of 21.7 percent compared to the 1,268 sales in October 2014, and an increase of 40.5 percent compared to the 1,098 sales in October 2013. The benchmark price of an apartment property increased 11.4 percent from October 2014 to $425,800.

Attached property sales in October 2015 totalled 666, an increase of 28.6 percent compared to the 518 sales in October 2014, and a 34.3 percent increase from the 496 attached properties sold in October 2013. The benchmark price of an attached unit increased 9.3 percent between October 2014 and 2015 to $526,700.


Download The Full Market Report Here

Read

VANCOUVER, B.C. – October 2, 2015 – Conditions continue to favour home sellers across *Metro Vancouver’s housing market.

The Real Estate Board of Greater Vancouver (REBGV) reports that residential property sales in Metro Vancouver reached 3,345 on the Multiple Listing Service® (MLS®) in September 2015. This represents a 14.5 percent increase compared to the 2,922 sales recorded in September 2014, and a 0.5 percent decrease compared to the 3,362 sales in August 2015.

Last month’s sales were 32.9 percent above the 10-year sales average for the month.

“Residential home sales have been trending at 25 to 30 percent above the ten-year sales average for most of the year. The number of homes listed for sale hasn’t been keeping up with the demand,” Darcy McLeod, REBGV president said. “It’s this dynamic that’s placing upward pressure on home prices, particularly in the detached home market.”

New listings for detached, attached and apartment properties in Metro Vancouver totalled 4,846 in September. This represents a 7.9 percent decline compared to the 5,259 new listings reported in September 2014.

The total number of properties listed for sale on the real estate board’s MLS® is 10,805, a 27 percent decline compared to September 2014 and a 0.8 percent decline compared to August 2015.

“At no point this year has the number of homes listed for sale exceeded 14,000, which is the first time this has occurred in the region since 2007,” McLeod said.

The MLS® Home Price Index composite benchmark price for all residential properties in Metro Vancouver is currently $722,300. This represents a 13.7 percent increase compared to September 2014.

The sales-to-active-listings ratio in September was 31 per cent. Generally, analysts say that downward pressure on home prices occurs when the ratio declines below the 12 percent mark, while home prices often experience upward pressure when it reaches 20 percent, or higher, in a particular community for a sustained period of time.

Sales of detached properties in September 2015 reached 1,272, an increase of 0.2 percent from the 1,270 detached sales recorded in September 2014, and a 24.3 percent increase from the 1,023 units sold in September 2013. The benchmark price for a detached property in Metro Vancouver increased 18.9 percent from September 2014 to $1,179,700.

Sales of apartment properties reached 1,529 in September 2015, an increase of 28.7 percent compared to the 1,188 sales in September 2014, and an increase of 50.2 percent compared to the 1,018 sales in September 2013. The benchmark price of an apartment property increased nine percent from September 2014 to $415,100.

Attached property sales in September 2015 totalled 544, an increase of 17.2 percent compared to the 464 sales in September 2014, and a 23.1 percent increase from the 442 attached properties sold in September 2013. The benchmark price of an attached unit increased 8.1 percent between September 2014 and 2015 to $518,600.


Download The Full Market Report Here

Read

It continues to be a competitive spring market for Metro Vancouver home buyers. This competition continues to put upward pressure on home prices, particularly in the detached home market.

The Real Estate Board of Greater Vancouver (REBGV) reports that residential property sales in Metro Vancouver reached 4,056 on the Multiple Listing Service® (MLS®) in May 2015. This represents a 23.4 percent increase compared to the 3,286 sales recorded in May 2014, and a decrease of 2.9 percent compared to the 4,179 sales in April 2015.

Last month’s sales were 16.7 percent above the 10-year sales average for the month.

“We continue to see strong competition for homes that are priced right for today’s market,” Darcy McLeod, REBGV president said. “It’s important to remember that real estate is hyper local, particularly in a seller’s market. This means that conditions and prices vary depending on property type, neighbourhood, and other factors."

New listings for detached, attached and apartment properties in Metro Vancouver totalled 5,641 in May. This represents a 5 percent decrease compared to the 5,936 new listings reported in May 2014.

The total number of properties currently listed for sale on the region’s MLS® is 12,336, a 23.2 percent decline compared to May 2014 and a 0.8 percent decline compared to April 2015.

“While the supply of homes for sale remains below what’s typical for this time of year, our region continues to offer a diverse selection of housing options at different price points,” McLeod said. “This diversity within the housing stock is part of what’s driving today’s home sale activity.”

The MLS® Home Price Index composite benchmark price for all residential properties in Metro Vancouver is currently $684,400. This represents a 9.4 percent increase compared to May 2014.

The sales-to-active-listings ratio in May was 32.9 percent. This is the highest that this ratio has been in Metro Vancouver since June 2007.

Sales of detached properties in May 2015 reached 1,723, an increase of 18.6 percent from the 1,453 detached sales recorded in May 2014, and a 42.2 percent increase from the 1,212 units sold in May 2013. The benchmark price for a detached property in Metro Vancouver increased 14.1 percent from May 2014 to $1,104,900.

Sales of apartment properties reached 1,600 in May 2015, an increase of 24.4 percent compared to the 1,286 sales in May 2014, and an increase of 40.8 percent compared to the 1,136 sales in May 2013. The benchmark price of an apartment property increased 4.6 percent from May 2014 to $396,900.

Attached property sales in May 2015 totalled 733, an increase of 34 percent compared to the 547 sales in May 2014, and a 37.3 percent increase from the 534 attached properties sold in May 2013. The benchmark price of an attached unit increased 6.4 percent between May 2014 and 2015 to $501,000.


Download The Full Market Report Here

Read

VANCOUVER, B.C. – May 4, 2015 – Strong home buyer demand coupled with below average home listing activity has created seller's market conditions within the Metro Vancouver* housing market.

The Real Estate Board of Greater Vancouver (REBGV) reports that residential property sales in Metro Vancouver reached 4,179 on the Multiple Listing Service® (MLS®) in April 2015. This represents a 37 percent increase compared to the 3,050 sales recorded in April 2014, and a 2.9 percent increase compared to the 4,060 sales in March 2015.

Last month’s sales were 29.3 percent above the 10-year sales average for the month.

“The supply of homes for sale today in the region is not meeting the demand we're seeing from home buyers. This is putting upward pressure on prices, particularly in the detached home market," Darcy McLeod, REBGV president said.

New listings for detached, attached and apartment properties in Metro Vancouver totalled 5,897 in April. This represents a 0.9 percent decrease compared to the 5,950 new listings reported in April 2014.

The total number of properties currently listed for sale on the region’s MLS® is 12,436, a 19.8 percent decline compared to April 2014 and an increase of 0.5 percent compared to March 2015.

“It’s a competitive and fast-moving market today that is tilted in favour of home sellers. To be competitive, it’s important to connect with a local REALTOR® who can help you develop a strategy to meet your home buying or selling needs,” McLeod said.

The MLS® Home Price Index composite benchmark price for all residential properties in Metro Vancouver is currently $673,000. This represents an 8.5 percent increase compared to April 2014.

The sales-to-active-listings ratio in April was 33.6 percent. This is the highest that this ratio has been in Metro Vancouver since June 2007.

Sales of detached properties in April 2015 reached 1,815, an increase of 35.9 percent from the 1,336 detached sales recorded in April 2014, and a 70.6 percent increase from the 1,064 units sold in April 2013. The benchmark price for a detached property in Metro Vancouver increased 12.5 percent from April 2014 to $1,078,900.

Sales of apartment properties reached 1,579 in April 2015, an increase of 34.7 percent compared to the 1,172 sales in April 2014, and an increase of 50.1 percent compared to the 1,052 sales in April 2013. The benchmark price of an apartment property increased 4.4 percent from April 2014 to $394,200.

Attached property sales in April 2015 totalled 785, an increase of 44.8 percent compared to the 542 sales in April 2014, and a 53.6 percent increase from the 511 attached properties sold in April 2013. The benchmark price of an attached unit increased 5.7 percent between April 2014 and 2015 to $493,300.


Download The Full Market Report Here

Read
Reciprocity Logo The data relating to real estate on this website comes in part from the MLS® Reciprocity program of either the Greater Vancouver REALTORS® (GVR), the Fraser Valley Real Estate Board (FVREB) or the Chilliwack and District Real Estate Board (CADREB). Real estate listings held by participating real estate firms are marked with the MLS® logo and detailed information about the listing includes the name of the listing agent. This representation is based in whole or part on data generated by either the GVR, the FVREB or the CADREB which assumes no responsibility for its accuracy. The materials contained on this page may not be reproduced without the express written consent of either the GVR, the FVREB or the CADREB.